 Ezz
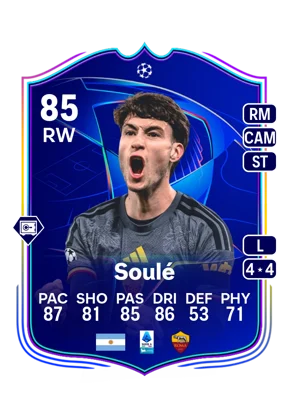

 UEFA Champions League RTTK
Matías Soulé
ArgentinaChemistry style
Turn on JavaScript to see this card with each chemistry style.
- Card
- UEFA Champions League RTTK
- Added
- 6 Nov 2026
- Position
- RW (also RM, CAM, ST)
- Club
- AS Roma
- League
- Serie A Enilive
- Nation
- Argentina
- Skill moves
- 4★
- Weak foot
- 4★
- PlayStyles+
- Press Proven+
- PlayStyles
- Finesse Shot, Low Driven Shot, Technical, Rapid
- Base card
- 80 CAM ›
Meta rating: Ezzcoins' own estimate of how well this card plays in game, worked out from its stats for each position it can play, its skill moves, weak foot and PlayStyle+. An average card scores about its overall rating; higher means it plays above its rating.
Watch on EzzcoinsEzzcoins price read
Worked out by Ezzcoins on 22 Nov 2026 from 157 console prices it recorded over the last 7 days. The live price above updates all day; this read is updated once a day.
- Trend: Falling, about 34% cheaper than a week ago.
- Usual range: Mostly between 20,250 and 39,250 coins, average 32,500 (lowest 16,000, highest 40,000). At the latest reading, 22,500, it was at the low end of its usual range.
- Daily swing: On a typical day its price moved about 23% between that day's low and high: a lively card.
- Flipping: Buying at the low end of its usual range (20,250) and selling at the high end (39,250) would have left about 17,037 coins per card after EA's 5% tax. That looks back at the week; it isn't a promise.
- Last 30 days: Between 16,000 and 65,500 coins on the console market.
| Measure | Console | PC |
|---|---|---|
| Usual 7-day range | 20,250–39,250 | 17,500–25,500 |
| 7-day low–high | 16,000–40,000 | 15,000–27,500 |
| 7-day average | 32,500 | 21,250 |
| 7-day trend | −34.4% | +4.2% |
| Typical daily swing | 23.2% | 19.3% |
| 30-day low–high | 16,000–65,500 | 15,000–45,250 |
How the price read works
Ezzcoins records this card's price about once an hour and keeps hourly prices for 7 days and daily prices for 30 days. A single price far off the readings on both sides of it (a glitched or mispriced listing) is left out. The usual range leaves out the cheapest and dearest 10% of hours, so it shows where the card really traded. The time of day compares each price with the card's median over the 24 hours around it, so a card that rose all week doesn't look "cheapest at midnight", and it is only shown when the pattern held on most days. EA keeps 5% of every sale, so a card has to rise about 5.3% before a flip breaks even. Everything here describes the past: prices can move differently next week.


